Quality Stock Research Every Sunday

We research quality US companies with strong fundamentals and real-world tailwinds — one fully scored medium to long-term research report every Sunday.

One research idea every Sunday · 13:00 UTC · three issues free, then $14.99/mo

Free research

All free research →
  • Jul 17
    NFLXNetflix, Inc.
    59/100
  • Jul 16
    ATAIAtaiBeckley Inc.
    56/100
  • Jul 15
    ASTSAST SpaceMobile, Inc.
    35/100
  • Jul 15
    PYPLPayPal Holdings, Inc.
    51/100
  • Jul 15
    CCJCameco Corporation
    Great
    potential
    54/100

We scan liquid US stocks (large and mid-sized names with enough daily trading volume) for businesses that can work over months and years — not quick trades or hype names.

Every finalist is scored the same way: business quality, valuation, macro theme fit, and whether the chart supports a patient entry. The Sunday issue is one conviction idea with clear risks and a clear verdict. If nothing clears our bar, we say pass — we do not force an idea just to fill the page.

Pick Ranking →

Last 10 Sunday research ideas — entry vs S&P 500 and sector ETF.

  • Jul 1278/100
    IDEAMember idea
    $199.02$204.72
    +2.9%-1.6%+0.1%
    Editorial status: Active
  • Jul 584/100
    IDEAMember idea
    $230.40$238.69
    +3.6%-0.2%-2.4%
    Editorial status: Active
  • Jun 2881/100
    IDEAMember idea
    $341.37$351.54
    +3.0%+1.9%+4.9%
    Editorial status: Active
  • Jun 2182/100
    IDEAMember idea
    $185.64$193.64
    +4.3%-0.5%-0.7%
    Editorial status: Active
  • Jun 1483/100
    IDEAMember idea
    $223.84$229.02
    +2.3%+0.2%+4.7%
    Editorial status: Active
  • Jun 774/100
    IDEAMember idea
    $160.69$154.59
    -3.8%+0.8%+0.5%
    Editorial status: Active
  • May 3180/100
    IDEAMember idea
    $148.80$150.85
    +1.4%-1.8%-7.9%
    Editorial status: Active
  • May 2480/100
    IDEAMember idea
    $342.93$367.69
    +7.2%-0.4%+4.6%
    Editorial status: Active

Four areas, the same every week — with clear reasoning behind each score.

Business quality

What the company does, how it makes money, and whether sales and profits are on a solid path — not a one-quarter story.

Valuation

Whether the price looks reasonable for what you are getting — compared with the company's own history and similar businesses, not a single magic number.

What could move the stock

Earnings, product launches, industry trends, and bigger economic themes — what might help or hurt the share price over the next several months.

What could go wrong

The main risks, what would change our mind, and when we would rather pass than publish a weak name.

Some long-running stock-picking services advertise average recommendation returns above 900%. Numbers like that can be real, but they usually refer to the average return of individual picks over time, not the compounded growth of one continuously invested portfolio.

Our scorecard should be read the same way. Each Picksmith idea is tracked as its own equal-dollar buy-and-hold research pick from publication date to the current measurement date, then compared with the S&P 500 over the exact same holding window. That makes the benchmark apples-to-apples, even when ideas were published in very different market conditions.

Why our return profile may look different

Picksmith is not designed to hunt for the most speculative moonshots in the market. We are generally trying to identify stronger businesses, clearer economic tailwinds, and setups that can compound over time.

You may already own higher-risk positions that can deliver huge returns if they work. Picksmith is meant to be the steadier base: stronger businesses and setups that can better weather difficult markets.

+2.6% Since May 24, 2026 · 8 Sunday picks tracked
Average pick
+2.6%
Average return across all published Sunday ideas, with each pick measured over its own holding window.
Median pick
+2.9%
The middle outcome across the track record, which helps show the typical result without a few big winners dominating the picture.
Vs S&P 500
+3.0%
Average outperformance versus the S&P 500 over the exact same start and end dates as each published pick.
  • One name, fully scored — thesis, risks, and context. Not a list of ten.
  • Long-term focus, overall score, and a simple “why now” plus preferred entry when the chart confirms
  • Business quality, macro tailwind, valuation, chart setup, and analyst alignment on one scorecard
  • Market backdrop, sector themes, and what to watch next
  • Archive included — every past Sunday issue, so you can see what we called and when.
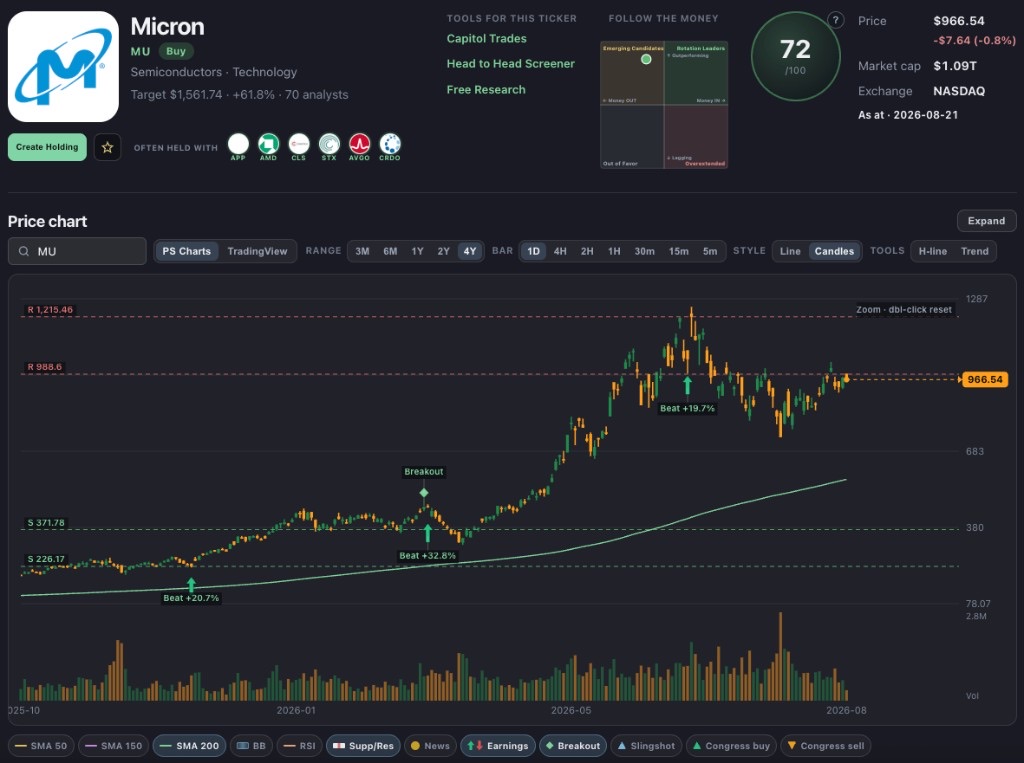
Stock chart showing a base under resistance, breakout on rising volume, price above 50-day and 200-day moving averages

The kind of early breakout “heartbeat” pattern we screen for every week

Three Sunday issues free

Full archive access — then $14.99/mo. Cancel anytime.

Our goal is one quality long-term idea every Sunday. Some weeks no name clears our bar — when the business, theme, and risk profile are not strong enough, we publish a pass day rather than lower the standard.